Monitoring Docsis CMTS
This is the link to go straight to download if you don't like reading stuff :) Not sure if you agree, but monitoring a Docsis CMTS is a boring task. Often it involves checking dozens os different graphs in order to check for the operational parameters. As the density of the CMTS increases, more ports to check. I decided to attempt to simplify it by putting all together in a single application. Check it below. Other screen shots here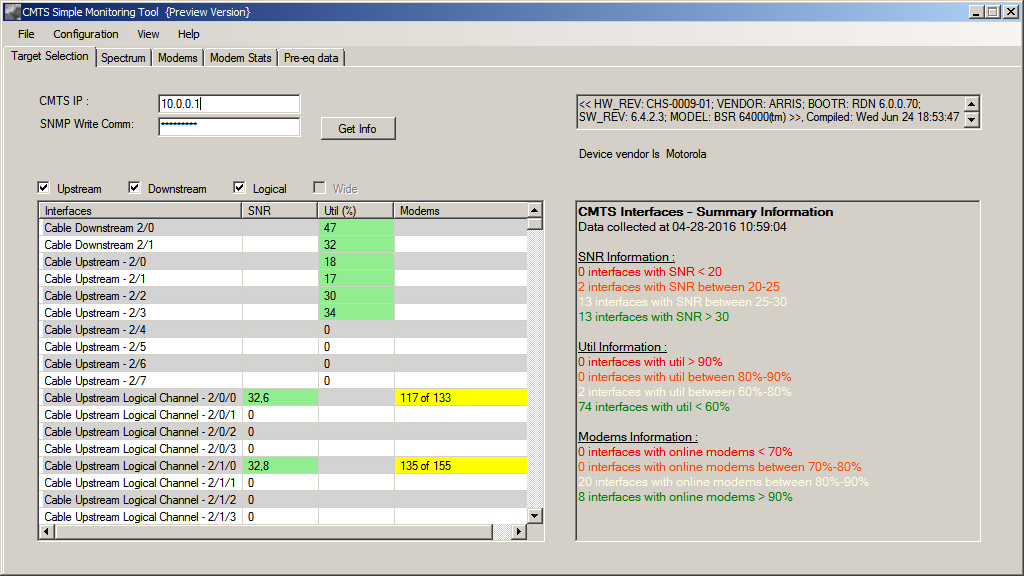
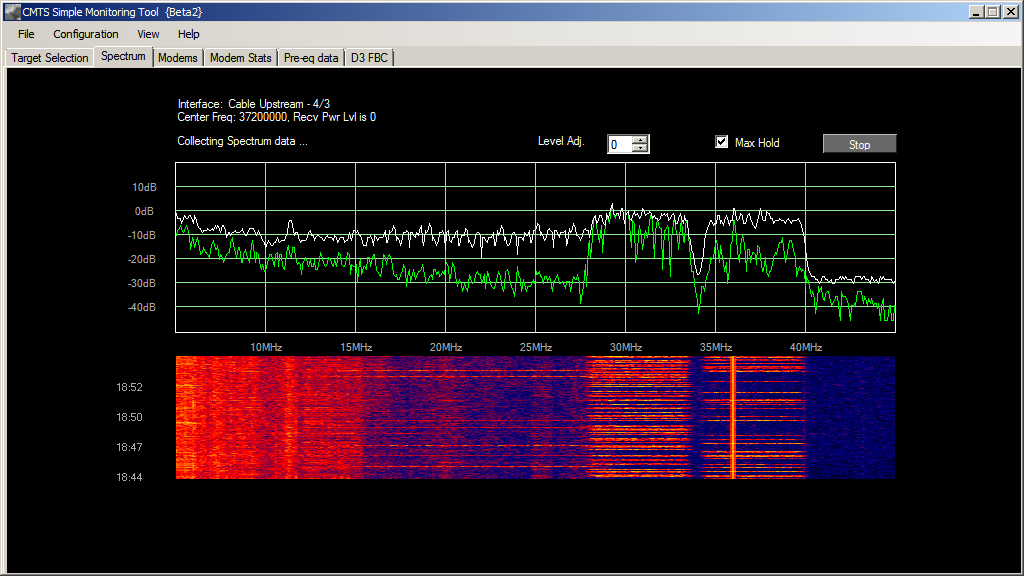
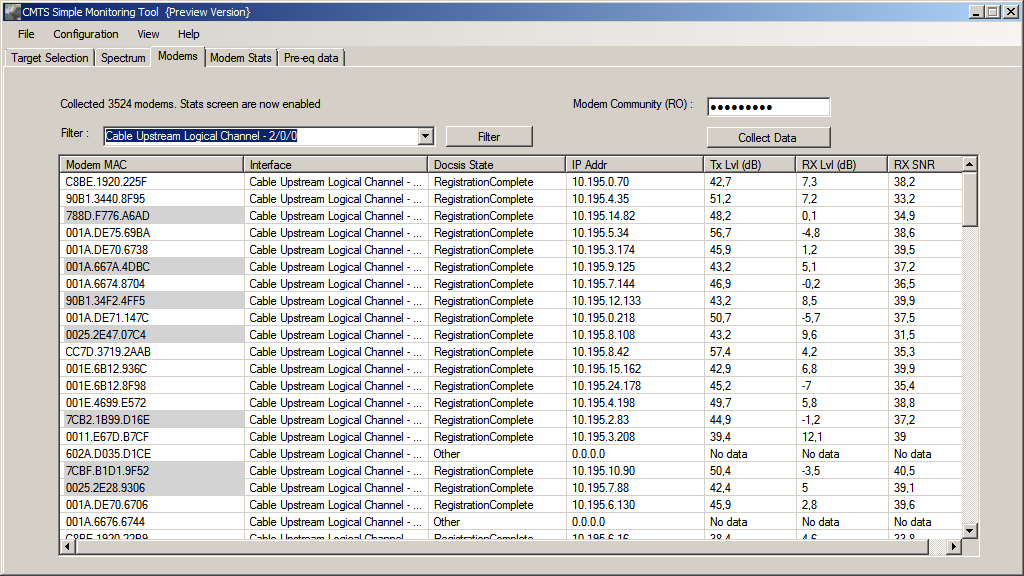
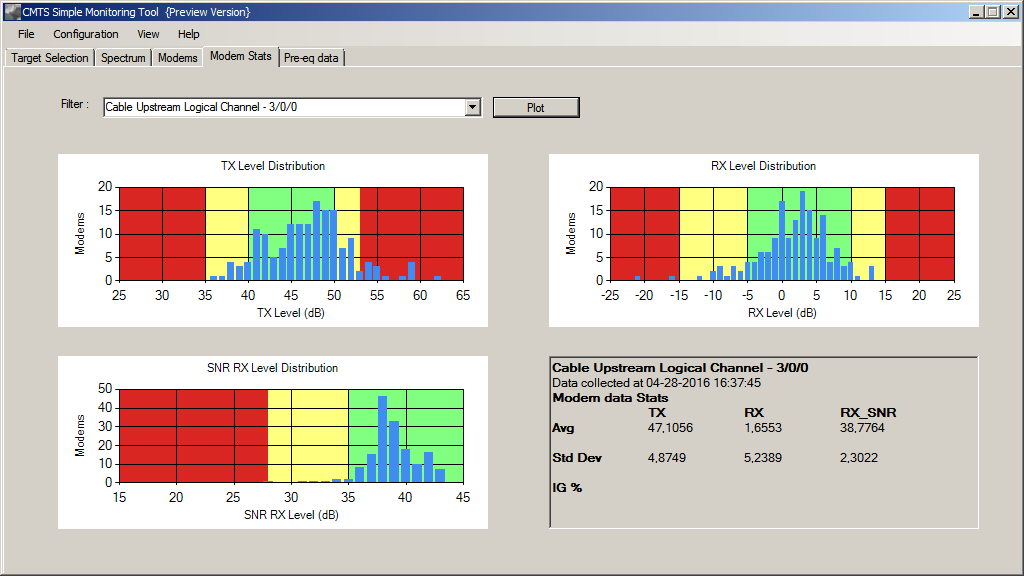
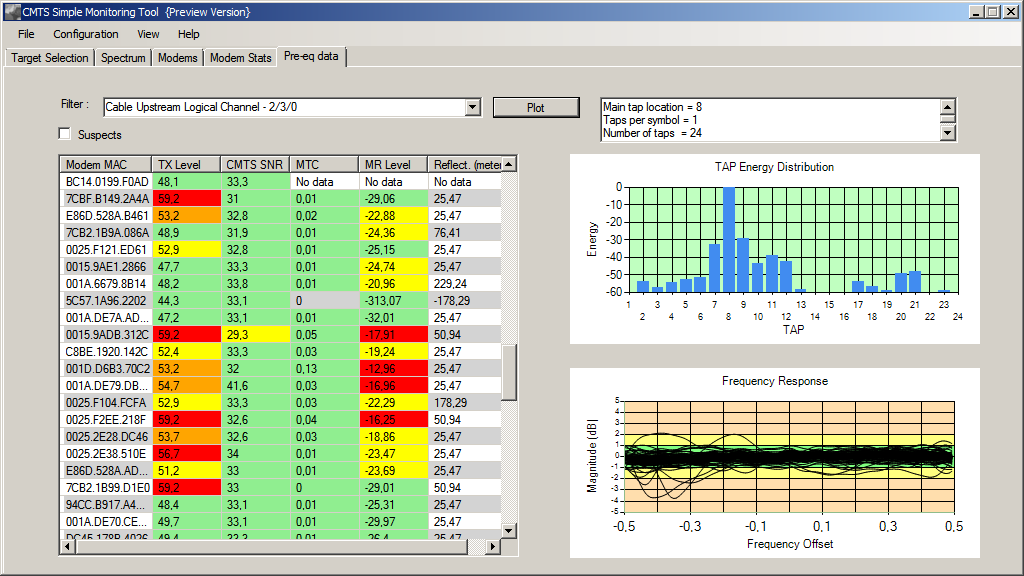
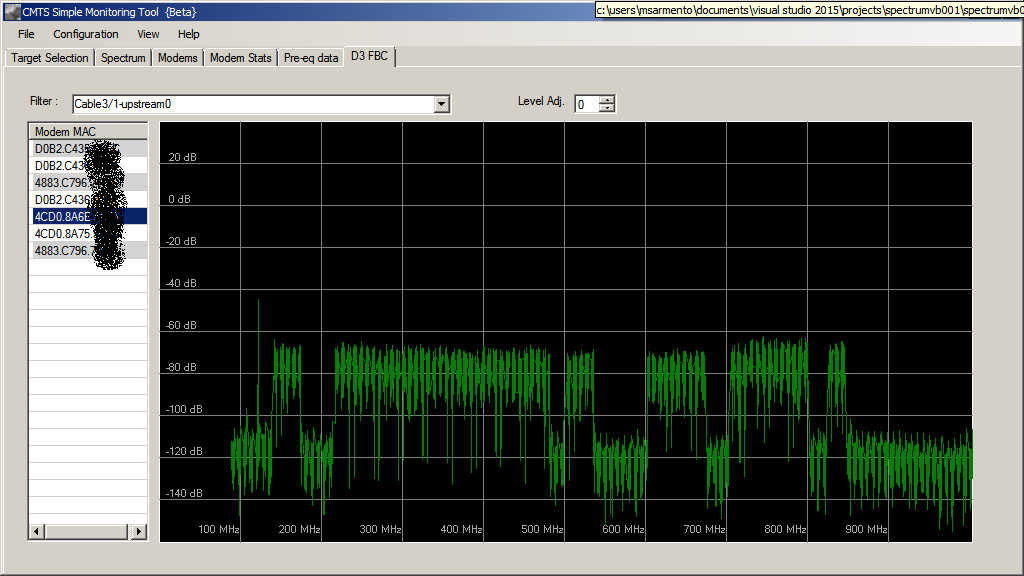
Usually, when someone asks if everything is ok with a particular CMTS, you check the basics:
- SNR
- Port Traffic Utilization
- Number of online modems
I know that often checking these are not enough, so I added some extra features described below.
The other application tabs are the following:
What you need
Of course, you need a Docsis CMTS to monitor. And you will need a SNMP Community (V3 is not supported) to access the CMTS.If you want to collect data from the modems, you will need a public SNMP community to read the modems (remember: you need connectivity to modem IP address, as well authorization on modem SNMP table).
- At least a Windows machine with 1024x768 resolution
- Download the zip file with application setup from here
(The SHA digest of the zip file is 82d286aa24d5812ac6e53250f6cbe548957caf9c). This is the Beta Version 1.5.2.0, it will
be upgraded to production soon. Some of the preview functions are not described here yet ... enjoy
Expand the zip file and run Setup.exe, install will start; - The process will download the required Microsoft stuff. *** NOTE: Depending on the OS, the application will start right after the install
- Download the required SNMP dll from http://www.snmpsharpnet.com/. It is an excellent SNMP library. It is needed because it is almost impossible to work with the native Windows SNMP Library. The files are on this link.
- Copy the SnmpSharpNet.dll to the same directory where the "CMTS Simple Monitoring Tool.exe" is.
- Run the application
What it does .. and doesn't
- My playground has a limited set of toys, and there is a lot of different hardware
and software versions around. Testing on every platform is difficult. If you have the opportunity to test it, please report your results
(it will be nice if you can include some screen shots)
- I have no idea on how the application will behave on M-CMTS environments.
- If you don't have access to a WRITE Community, you will not be able to use the Spectrum. With a READ community, regular data collection should work.
- SNR, Utilization and Online Modems will be collected at regular configurable intervals
- Spectrum is collected at short intervals (1-2 seconds). Some CMTS software versions can show high CPU util, take a look on it to see if your CMTS is suffering with it
- Waterfall will record up to 2 hours of the upstream history.
- Modems stats and pre-eq are enabled just after all modems are collected.
- Interfaces are shown using a classical color scheme:
Red = Critical => Do something NOW!
Orange = Marginal => Do something (as soon as you get the Critical ones fixed)
Yellow = Warning => Better check it before things getting worst
Green = OK => Read a book :). (Just kidding, go check the graphs).
Compatibility Matrix
This is the actual "Compatibility Matrix", collected from feedbacks I received so far: If you tested it sucessfully with a configuration that is not on the list, please let me know! Vendors: if you want to see your CMTS on the list, please contact me.| Vendor | Model | SW Version |
| Cisco | UBR 7246VXR with MC88 | 122-33.SCF4 |
| Cisco | UBR 7246VXR with MC28U | 12.3(9a)BC7 |
| Cisco | UBR 10K with MC20x20V | 12.2(33)SCF2 |
| Cisco | UBR 10K with MC20x20V | 12.2(33)CX |
| Motorola | BSR64k with 2x8, TX32 | 6.4.2.3 |
| Motorola | BSR64k with 2x8, TX32 | 5.3.1P32.H44.KRBU |
| Casa systems | C3200 | 6.1.4 |
| Casa systems | C100G | 6.5.2 |
| Arris | C4 (**) | V08.02.05.74 |
Using the Application
- Input the CMTS IP and Community
- Click "Get Info"
- If you have the proper SNMP access, the Interfaces list will be filled and periodically updated
- Double click on an upstream interface to see the Spectrum and Waterfall
- Play with the configuration and options. No rocket science here
- Clink on Colunm headers to sort the list
FAQ
I will update the FAQ as soon as I receive questions. For now, here are some possible questions.- What are the alarm levels? Levels are hard-coded for now. Adding configurable parameters is on the TO-DO list.
- Do I really need a Write SNMP access? Yes and No. If your CMTS supports Spectrum, you will need Write rigths to set the interface to be monitored. That's the way the protocol works. You may want to restrict the SNMP Writes to a particular branch of the tree. That's not difficult to, just check the manuals.
- How to interpret the Waterfall screen? This is a concept borrowed from the RTL-SDR community. In order to check the frequencies where the signals are present, it is common to see a waterfall-style screen where the signal levels are presented as a "heatmap". So what you see is "hot" colors where the signal is high, and "cold" colors where the signal is weak or absent.
- What's about the Zombie Mode? Zombie Mode will instruct the application to walk endlessly through the CMTS upstreams and save the info on a per-upstream waterfall. When double-clicking the upstream on the interfaces list, you will see this instead of the "live" spectrum. It is on development.
- Why the range of the levels is just -50 to +20? Despite the fact the CMTS ranges are -50 to +50, the typical configuration for receive power is Zero. It is very unusual to see levels at the upstream ports of the CMTS going up to +20dB.
| . | Critical | Marginal | Warning | OK |
| SNR | <25 | 20-25 | 25-30 | >30 |
| Utilization % | >90 | 80-90 | 70-80 | <70 |
| Online Modems % | <60 | 60-80 | 80-90 | >90 |
If you only have a Read community, everything else should work.
In general, when you see a max-hold peak you don't know how long it lasted. The waterfall screen helps answering questions like this.